Data Products
All data products produced by BANZAI-NRES are available to users. We produce 3 separate files per science observation to minimize the bandwidth necessary for our users. All products are available from the normal LCO Archive.
Preview PDFs
For quick look information about an observation, we provide a summary PDF of the observation showing a few important regions of the spectrum. These are primarily aimed to be diagnostic plots of the observation quality. The naming convention of the summary PDFs follows the standard LCO naming convention, replacing the last ‘e00.fits’ with ‘e92-summary.pdf’. An example of the pages are below with some additional explanation.
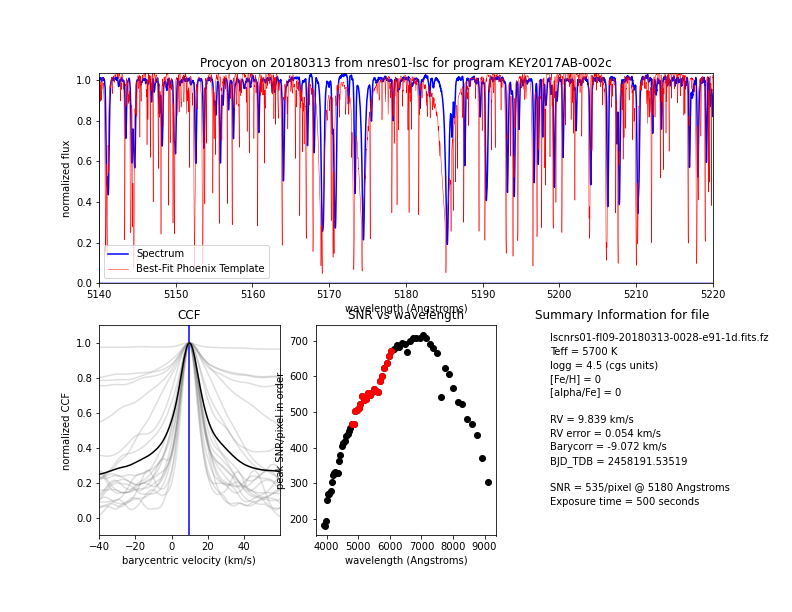
Top: the continuum-normalized spectrum (blue) and best-fit Phoenix model template (red) for the order containing the Mg b triplet. Bottom left: combined normalized CCF from all of the orders used to compute the RVs (black) and the CCFs for all of the individual orders (gray). Note that the RVs are measured for each of the individual orders and then averaged to compute the final RV measurement; the combined CCF shown here is computed only for display purposes. Bottom center: peak SNR per pixel for each order of the extracted spectrum. The orders used to measure the RV are highlighted in red. Bottom right: summary information on the stellar classification, RV measurement, and exposure parameters. These and other parameters can also be found in the fits headers.
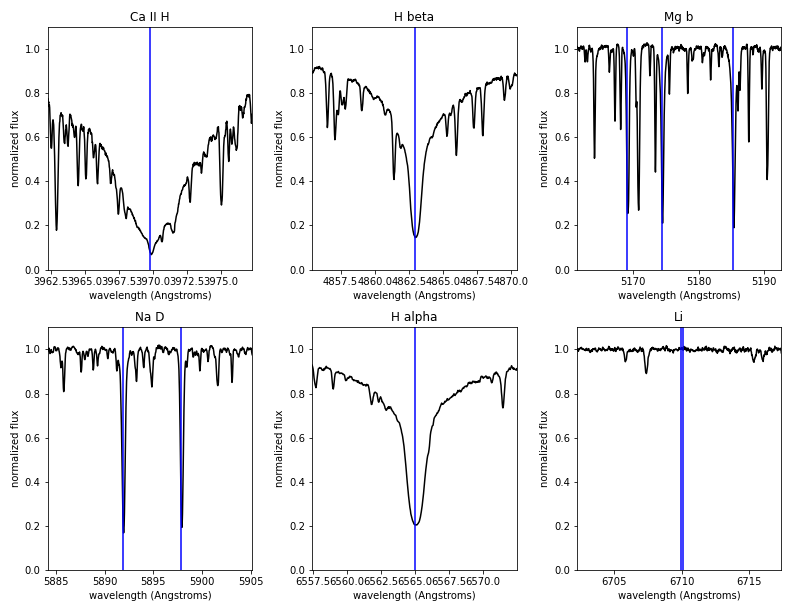
The second page of the PDF report shows zoom-ins around six lines or regions of general interest: Ca H, H alpha and beta, the Mg b triplet, the Na D doublet, and the Li line near 6700 Angstroms. The vertical blue lines show the position of the line centers given the measured stellar RV.
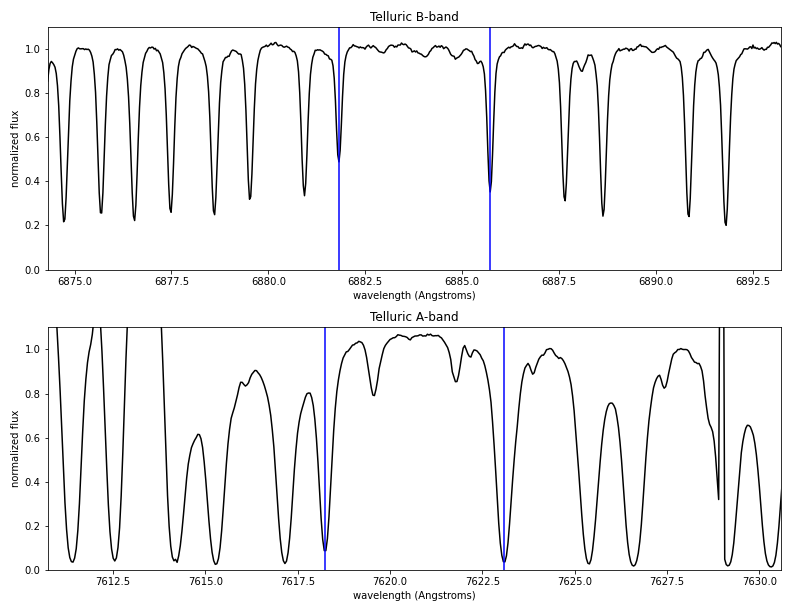
The third page of the PDF report shows two regions of the telluric A and B bands. The vertical blue lines show the wavelengths of two representative absorption lines.
Extracted Spectra
The primary data products we provide are the 1-D extracted wavelength-calibrated spectra. The file naming convention for these products follows the standard LCO naming convention replacing ‘e00.fits’ with ‘e92-1d.fits’. These spectra are stored in a FITS binary table. As such they are in extension 1 of the FITS file. The extension is also named SPECTRUM for easy access. The columns included in the table are below:
‘id’: Integer ID of the trace in this row. This corresponds to the number in the TRACE extension of the 2-D calibration products.
‘order’: Physical dispersion order of this trace.
‘fiber’: Fiber ID. The calibration fiber is always 1. The science fiber is either 0 or 2. The science fiber on the target can be determined from the ‘SCIFIBER’ keyword in the header.
‘wavelength’: Wavelength per pixel for this trace (Angstroms).
‘flux’: Extracted flux (counts). No blaze correction or continuum normalization is performed on this data.
‘uncertainty’: Formal uncertainty of the extracted flux propagated from the previous processing stages. No blaze correction or continuum normalization is performed on this data.
‘blaze’: Extracted estimate of the blaze function from the quartz lamp flat field.
‘blaze_error’: Formal uncertainties on the blaze due to the Poisson statistics in the quartz lamp flat field.
‘mask’: Bad pixels have values greater than zero.
‘normflux’: Extracted flux after the blaze and continuum have been divided out.
‘normuncertainty’: Formal uncertainty of the extracted pixels after scaling by the blaze and continuum.
Results from the cross correlation are stored in the ‘CCF’ FITS binary table extension. The columns are:
‘order’: Physical dispersion order of this trace. This maps to the ‘order’ column in the ‘SPECTRUM’ extension.
‘v’: Velocity (km / s).
‘xcor’: Cross correlation value.
2-D Spectroscopic Frames
We provide the full 2-D frames that have not been extracted for users who wish to perform advanced analysis on their data. These files are much larger than the extracted spectra so are provided as a separate FITS file following the standard LCO naming convention replacing ‘e00.fits’ with ‘e92-2d.fits’. Each extension is named, so we recommend accessing the data by name so that any analysis code is insensitive to order changes in the FITS files. A list of extension names and a description of their contents are below.
‘SPECTRUM’: 2-D non-extracted image after subtracting the bias and dark frames.
‘ERR’: 2-D frame of the of formal uncertainties including the read noise, Poisson contribution, the bias subtraction, and the dark subtraction.
‘BPM’: Bad pixel mask (unsigned 8-bit integer). BPM = 1 for known bad pixels. BPM = 2 for saturated pixels.
‘EXPOSURE_METER’, ‘AGU_1’, ‘AGU_2’, ‘TELESCOPE_1’, and ‘TELESCOPE_2’: Exposure meter data, AGU information, and telescope information all direct copies from the raw data. See raw data documentation for more explanation on these extensions.
The rest of the data necessary for NRES data processing are stored in super-calibration frames that were used to process this data and are described below.
Calibration files
All calibration files are available via the LCO Archive. The filenames of the stacked calibration frames used to reduce each science spectrum can be found in the science spectrum headers. The relevant keywords are: L1IDMASK (bad pixel mask), L1IDBIAS (bias), L1IDDARK (dark), L1IDFLAT (flat), and L1IDARC (ThAr).
Bias and Dark Frames
Stacked bias and dark frames are available via the LCO archive. These can be found with OBSTYPE=BIAS and DARK, respectively.
Bad Pixels Masks
Masks with known bad pixels are available in the archive under OBSTYPE=BPM. Non-zero values are bad pixels.
Line List
The line list we use for wavelength calibration is available via the LCO archive as OBSTYPE=LINELIST.
Lamp Flats
We take a series of quartz lamp flat fields to measure the positions of the traces on the CCD and to estimate the profile. These files have the following extensions:
‘SPECTRUM’: 2-D stacked frame of the lamp flat spectrum after bias and dark subtraction and dividing out the profile and blaze.
‘BPM’: Bad pixel mask (unsigned 8-bit integer). BPM = 1 for known bad pixels. BPM = 2 for saturated pixels.
‘ERR’: Formal uncertainties on the stacked quartz lamp flats after bias and dark subtraction and dividing out the profile and blaze.
‘TRACES’: Integer mask with the extraction regions. Each value corresponds to the ‘id’ column in the extracted data product.
banzai_nres.utils.trace_utils.get_trace_regionis a useful method to get the numpy slice corresponding to a given trace region.‘PROFILE’: Profile estimate from the stacked lamp flat. Non-zero only where the ‘TRACE’ extension is non-zero. The profile is normalized so the sum in each column of each trace is unity. This extension is compressed, but it is compressed using the GZip algorithm instead of RICE compression like most of the rest of the image extensions produced by LCO, because GZip is lossless.
‘BLAZE’: FITS Binary table with the estimate of the ‘blaze’ and ‘blaze_error’ from the stacked lamp flat. ‘id’ values correspond to the regions in the ‘TRACE’ extension.
‘WEIGHTS’: 2-D frame of optimal extraction weights based on the profile extension described above. Using the
get_trace_regionmethod can be used to easily reapply these weights and sum to produce an extraction.
ThAr Arc Lamps
Note that the Thorium-Argon lamp spectra are referred to as “double” spectra within the pipeline for historical reasons relating back to the IDL Commissioning Pipeline. These spectra have the following extensions:
‘SPECTRUM’: 2-D stacked frame of the ThAr arc lamp spectrum after bias and dark subtraction, used for the wavelength solution.
‘BPM’: Bad pixel mask (unsigned 8-bit integer). BPM = 1 for known bad pixels. BPM = 2 for saturated pixels.
‘ERR’: Formal uncertainty on the 2-D stacked frame of the ThAr arc lamp spectrum after bias and dark subtraction.
‘WAVELENGTH’: 2-D frame of the wavelength model evaluated at the center of every pixel, in Angstroms. This extension is compressed, but it is compressed using the GZip algorithm instead of RICE compression like most of the rest of the image extensions produced by LCO, because GZip is lossless.
‘FEATURES’: FITS binary table with the centroids of the detected features in the stacked ThAr arc lamp frames. These features are used to fit the wavelength solution. The pixel positions are stored in the ‘x_centroid’ and ‘y_centroid’ columns. The ‘flux’ and ‘fluxerr’ columns store the brightness of the features, while ‘corrected_flux’ is the blaze-corrected flux and ‘peak’ is the peak flux in a pixel within the feature. The error on the centroid is stored in the ‘centroid_err’ column. The ‘id’ column corresponds to the value in the ‘TRACES’ extension of the stacked quartz lamp flat, while ‘order’ and ‘fiber’ are the physical order and fiber number, respectively. ‘wavelength’ is the laboratory vacuum wavelength of each feature. ‘sharpness’, ‘roundness1’, and ‘roundness2’ are measures of the 2-D morphology of each feature.
‘FIBERS’: FITS binary table mapping the order number from the TRACES extension to fiber number.
Data Product Differences from the Commissioning Pipeline
The main difference between the 1-D data products produced by the commissioning pipeline and BANZAI-NRES is that we have formatted the data into a FITS Binary table instead of using multiple FITS extensions. This makes the association between the different pieces of data more explicit and alleviates some issues when compressing the files with fpack.
Below are the extension names from the FITS extensions from the previous data products and how they map to the columns in the extracted spectra produced by BANZAI-NRES. Rather than splitting the ThAr fiber and the science fiber into separate extensions, BANZAI-NRES interleaves the orders in the FITS binary table.
‘SPECRAW’ Extension: ‘flux’ column.
‘SPECFLAT’ Extension: ‘normflux’ column is the closest analog. The ‘normflux’ column includes extra continuum normalization compared to the commissioning pipeline.
‘SPECBLAZE’ Extension: This is the blaze subtracted spectrum. We do not provide this explicitly, but BANZAI-NRES does provide the ‘blaze’ column and the ‘flux’ columns to calculate this.
‘THARRAW’ Extension: This is the flux of the ThAr fiber orders. These are interleaved with the science fiber in the ‘flux’ column .
‘THARFLAT’ Extension: Flat-field divided ThAr fiber spectrum. These are interleaved with the science fiber in the ‘normflux’ column.
‘WAVESPEC’ Extension: Wavelengths solutions per pixel for the science fiber. These are stored in the ‘wavelength’ column in BANZAI-NRES data products. Note that the commissioning pipeline stored these in values in nanometers. BANZAI-NRES stores wavelengths in Angstroms.
‘WAVETHAR’ Extension: Wavelengths solutions per pixel for the calibration ThAr fiber. These are stored in the ‘wavelength’ column in BANZAI-NRES data products and are interleaved with the science spectrum orders. Note that the commissioning pipeline stored these values in nanometers. BANZAI-NRES stores wavelengths in Angstroms.
‘SPECXCOR’ Extension: Summed cross correlation function (CCF) for a range of velocities. The velocity for a given pixel is saved as the WCS in the header. BANZAI-NRES stores its cross-correlation results in the ‘CCF’ extension as a FITS binary table. Rather than saving the summed CCF, we store the CCF per order and corresponding velocity coordinates for clarity for the user.
‘RVBLOCKFIT’ Extension: Per-order/per-block RVs in a FITS Binary table. As we do not calculate radial velocities using blocks, BANZAI-NRES does not include this extension.